LED Visualizer: Music You Can See
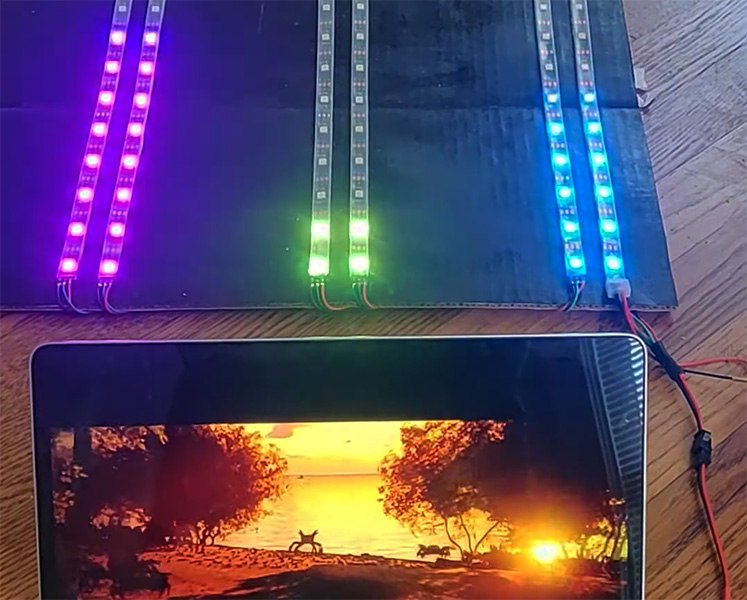
The LED Visualizer was my final project for ELEC 327 at Rice in Spring 2022, and I built it on my own. The idea was simple: split the sound a device hears into bands of frequencies across the range of human hearing, and drive a display that reacts to each band in real time. It ended up with an analog filter bank, an MSP430 microcontroller, a custom PCB, and a strip of 150 addressable RGB LEDs.
The idea
Most music visualizers run on a computer that already has the audio as clean digital data. I wanted a standalone device that just listens: put it in a room, play music, and watch the bass, mids, and highs light up on their own. That left me with a few constraints:
- A small microcontroller (the MSP430) with limited processing power and memory
- An analog microphone as the only input
- A display that stays interesting at both loud and quiet volumes, and goes dark during silence instead of flickering from noise
- WS2812B LEDs, whose timing-based protocol the MSP430 doesn't support natively
The system
The device has three stages: analog filtering, sampling and processing, and output to the LEDs.
Input: a passive RC filter bank. An electret microphone amplifier breakout feeds three first-order RC filters in parallel, which split the signal into low, mid, and high bands. I simulated the filter responses in ADS before building them.
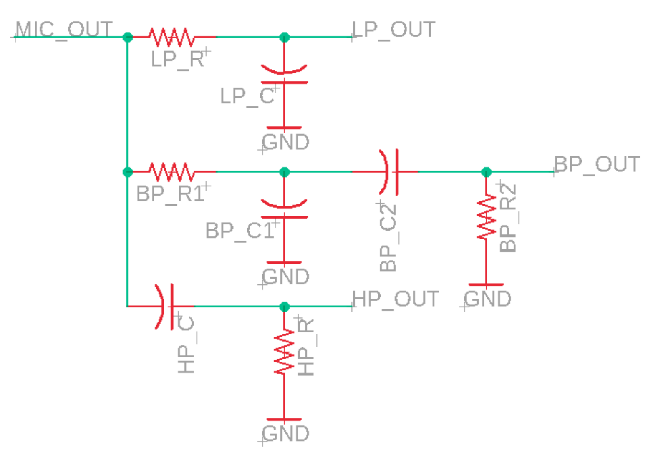
| Filter | Resistor | Capacitor | Cutoff frequency |
|---|---|---|---|
| Lowpass | 100 kΩ | 0.1 µF | 15.9 Hz |
| Bandpass (LP stage) | 2.2 kΩ | 0.1 µF | 723 Hz |
| Bandpass (HP stage) | 1 kΩ | 0.47 µF | 339 Hz |
| Highpass | 470 Ω | 0.1 µF | 3.39 kHz |
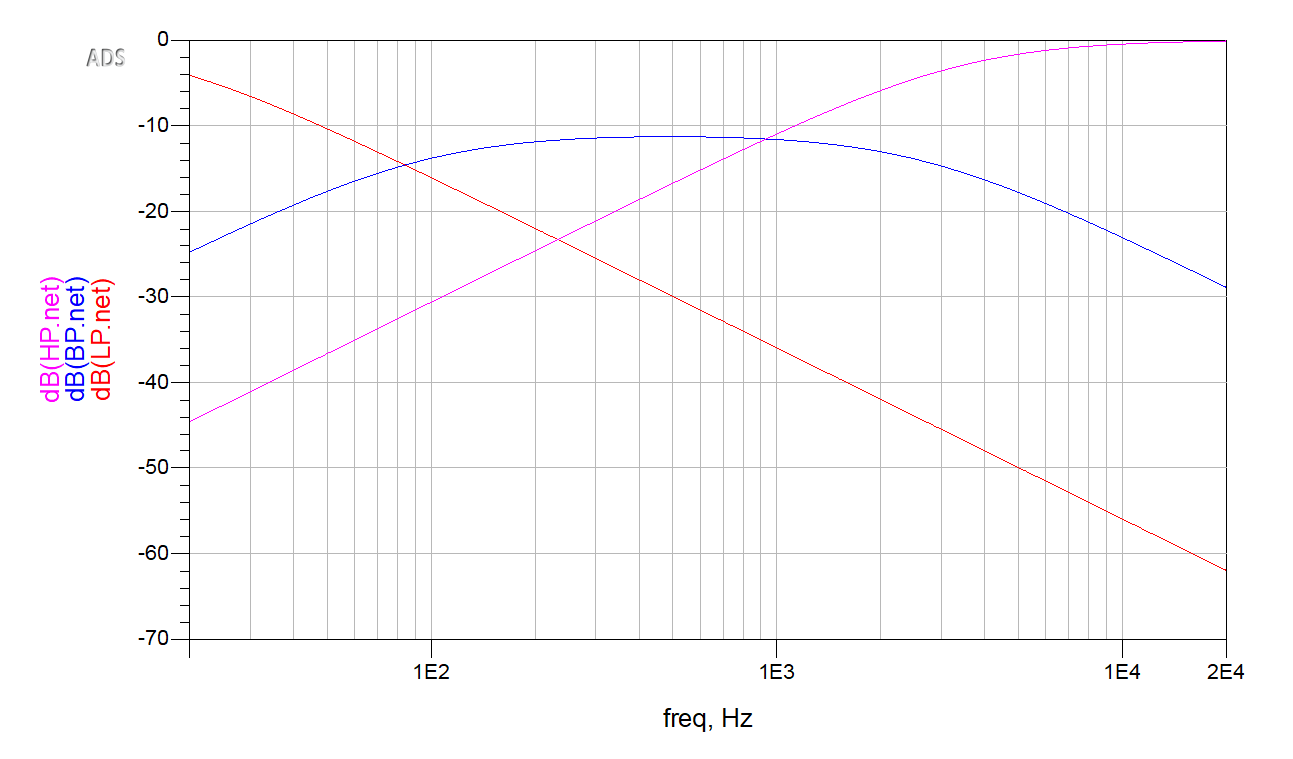
Processing: an "energy" model on the MSP430. Each filter output goes to its own pin, and the MSP430's ADC reads the three in sequence through its multiplexer. The code is built to pick out sudden changes in each band at any volume:
- On every loop, the MSP430 samples all three bands.
- If a band's moving average over its last 16 samples is high enough to be more than noise, and the current sample is high enough relative to that average, the band's "energy" goes up.
- After 96 sampling cycles, the accumulated energy is folded into a moving average of the last four totals, rescaled to a level from 1 to 24, and sent to the LEDs.
- Between sampling bursts, the MSP430 drops into low-power mode (LPM0).
Output: WS2812B LEDs over SPI. WS2812B LEDs encode each bit as a ratio of high time to low time on the data line, a protocol the MSP430 has no hardware for. I repurposed the SPI peripheral to produce it: every LED bit is sent as a group of SPI bits with the right duty cycle (for example, 1000 for a short-high "0"). Colors go out in GRB order. The driver is adapted from an open-source MSP430 WS2812 library. I removed the functionality I didn't use, and instead of reading a fixed color array, it now calls a function passed in as a parameter for each LED's color. That cut steps out of every frame.
The 150-LED strip is arranged as two parallel runs of 75 that receive the same data. The LEDs are paired, and each band gets 25 pairs.
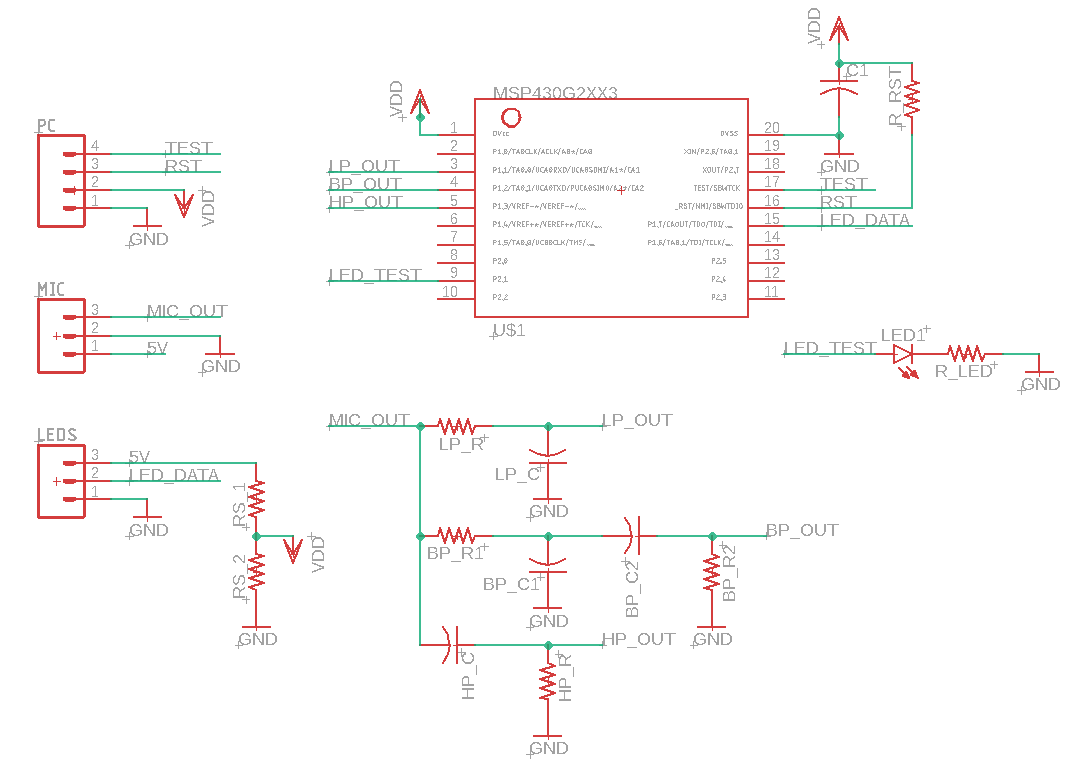
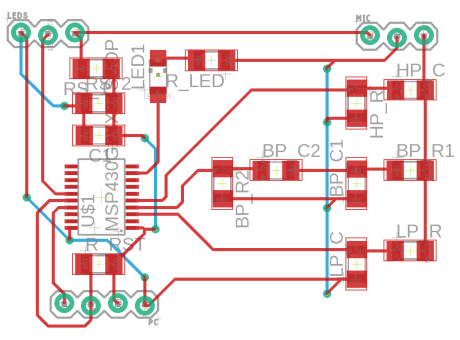
PCB. I designed a custom board in Eagle for the project and iterated on it over the course's PCB rounds.
What I measured and learned
- The display works at any volume. Tracking changes against a moving average, rather than raw amplitude, kept the visuals active at quiet and loud volumes and kept the strip dark during silence.
- Powering the MCU from the LED supply was a mistake. The board originally ran the MSP430 off the LED power supply through a resistor divider. The LEDs' quick swings in current draw, among other factors, made that unreliable, so the final version runs the MSP430 off a coin cell.
- Analog vs. digital filtering. I chose to split the bands with analog filters rather than in firmware. That keeps the MSP430's limited processing time for sampling and driving the LEDs. The cost is that the bands are fixed in hardware.